-
Bug
-
Resolution: Unresolved
-
P3: Somewhat important
-
None
-
Qt Creator 4.9.0, Qt Creator 4.9.1, Qt Creator 4.9.2
-
uname -a: 4.19.60-1-MANJARO #1 SMP PREEMPT Sun Jul 21 12:17:26 UTC 2019 x86_64 GNU/Linux
valgrind --version: valgrind-3.14.0
Code snippet used in testing:
int main() {
char *bytes = new char[12];
(void)bytes;
}
The project is configured with cmake, here is the CMake snippet:
cmake_minimum_required(VERSION 2.8)
project(Test)
add_executable(${PROJECT_NAME} "main.cc")
set(CMAKE_CXX_FLAGS "${CMAKE_CXX_FLAGS} -Wall -Wextra")
The console valgrind gets the following output:
==2599== Memcheck, a memory error detector
==2599== Copyright (C) 2002-2017, and GNU GPL'd, by Julian Seward et al.
==2599== Using Valgrind-3.14.0 and LibVEX; rerun with -h for copyright info
==2599== Command: ./TemplateSubstFailure
==2599==
==2599==
==2599== HEAP SUMMARY:
==2599== in use at exit: 12 bytes in 1 blocks
==2599== total heap usage: 2 allocs, 1 frees, 72,716 bytes allocated
==2599==
==2599== LEAK SUMMARY:
==2599== definitely lost: 12 bytes in 1 blocks
==2599== indirectly lost: 0 bytes in 0 blocks
==2599== possibly lost: 0 bytes in 0 blocks
==2599== still reachable: 0 bytes in 0 blocks
==2599== suppressed: 0 bytes in 0 blocks
==2599== Rerun with --leak-check=full to see details of leaked memory
==2599==
==2599== For counts of detected and suppressed errors, rerun with: -v
==2599== ERROR SUMMARY: 0 errors from 0 contexts (suppressed: 0 from 0)
And xml dump looks like this:
Maybe due to a bug of this dashboard system, the monospace part was corrupted, so I pasted the information onto https://pastebin.com/EN54tiuU and it will be valid in the next 1 month.
<?xml version="1.0"?>
<valgrindoutput>
<protocolversion>4</protocolversion>
<protocoltool>memcheck</protocoltool>
<preamble>
<line>Memcheck, a memory error detector</line>
<line>Copyright (C) 2002-2017, and GNU GPL'd, by Julian Seward et al.</line>
<line>Using Valgrind-3.14.0 and LibVEX; rerun with -h for copyright info</line>
<line>Command: ./TemplateSubstFailure</line>
</preamble>
<pid>2779</pid>
<ppid>2202</ppid>
<tool>memcheck</tool>
<args>
<vargv>
<exe>/usr/bin/valgrind</exe>
<arg>--xml=yes</arg>
<arg>--xml-fd=1</arg>
</vargv>
<argv>
<exe>./TemplateSubstFailure</exe>
</argv>
</args>
<status>
<state>RUNNING</state>
<time>00:00:00:00.109 </time>
</status>
<status>
<state>FINISHED</state>
<time>00:00:00:00.491 </time>
</status>
<error>
<unique>0x0</unique>
<tid>1</tid>
<kind>Leak_DefinitelyLost</kind>
<xwhat>
<text>12 bytes in 1 blocks are definitely lost in loss record 1 of 1</text>
<leakedbytes>12</leakedbytes>
<leakedblocks>1</leakedblocks>
</xwhat>
<stack>
<frame>
<ip>0x483950F</ip>
<obj>/usr/lib/valgrind/vgpreload_memcheck-amd64-linux.so</obj>
<fn>operator new[](unsigned long)</fn>
<dir>/build/valgrind/src/valgrind/coregrind/m_replacemalloc</dir>
<file>vg_replace_malloc.c</file>
<line>423</line>
</frame>
<frame>
<ip>0x109151</ip>
<obj>/home/icey/program/c14/build-TemplateSubstFailure-unknown-Debug/TemplateSubstFailure</obj>
<fn>main</fn>
<dir>/home/icey/program/c14</dir>
<file>TemplateSubstFailure/main.cc</file>
<line>2</line>
</frame>
</stack>
</error>
<errorcounts>
</errorcounts>
<suppcounts>
</suppcounts>
</valgrindoutput>
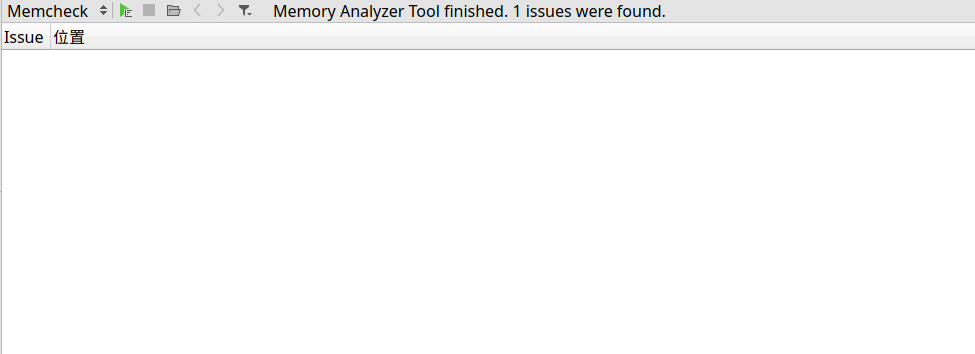
When I starts the memory analyzer, it successfully executes the valgrind, got the issue count correctly, but turns out to have not extra diagnostics information.

I tried both pacman packed QtCreator and self-installed QtCreator downloaded from download.qt.io, but neither of them works correctly.