from PyQt6 import QtWidgets
from PyQt6 import QtCore
from PyQt6 import QtGui
from PyQt6.QtCore import Qt
def create_chart(points, xrange, yrange):
    ch=QtCharts.QChart()
    cv=QtCharts.QChartView(ch)
    xaxis = QtCharts.QValueAxis()
    yaxis = QtCharts.QValueAxis()
    xaxis.setTickAnchor(1)
    xaxis.setTickInterval(1)
    xaxis.setRange(xrange[0], xrange[1])
    yaxis.setTickInterval(1)
    yaxis.setTickAnchor(1)
    yaxis.setRange(yrange[0], yrange[1])
    ch.addAxis(xaxis, Qt.AlignBottom)
    ch.addAxis(yaxis, Qt.AlignLeft)
    ss=QtCharts.QScatterSeries()
    ss.setBestFitLineVisible(True)
    for point in points:
        ss.append(point[0], point[1])
    ch.createDefaultAxes()
    ch.addSeries(ss)
    cv.show()
    return cv
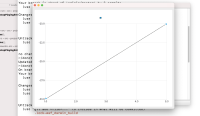
Case#1: Qt shows best fit line with this input.
create_chart([[2, -26.957], [3, -23.022]], [1, 5], [-30, -20])
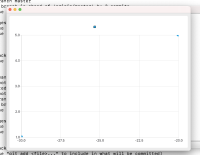
Case#2: Qt does not show best fit line with this input
create_chart([[ -26.957, 2], [-23.022, 3]], [-30, -20], [1, 5])
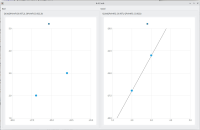
The only difference is axis values are swapped.
- relates to
-
QTBUG-89453 Feature Request: Support best fit line display for data points
-

- Reported
-


